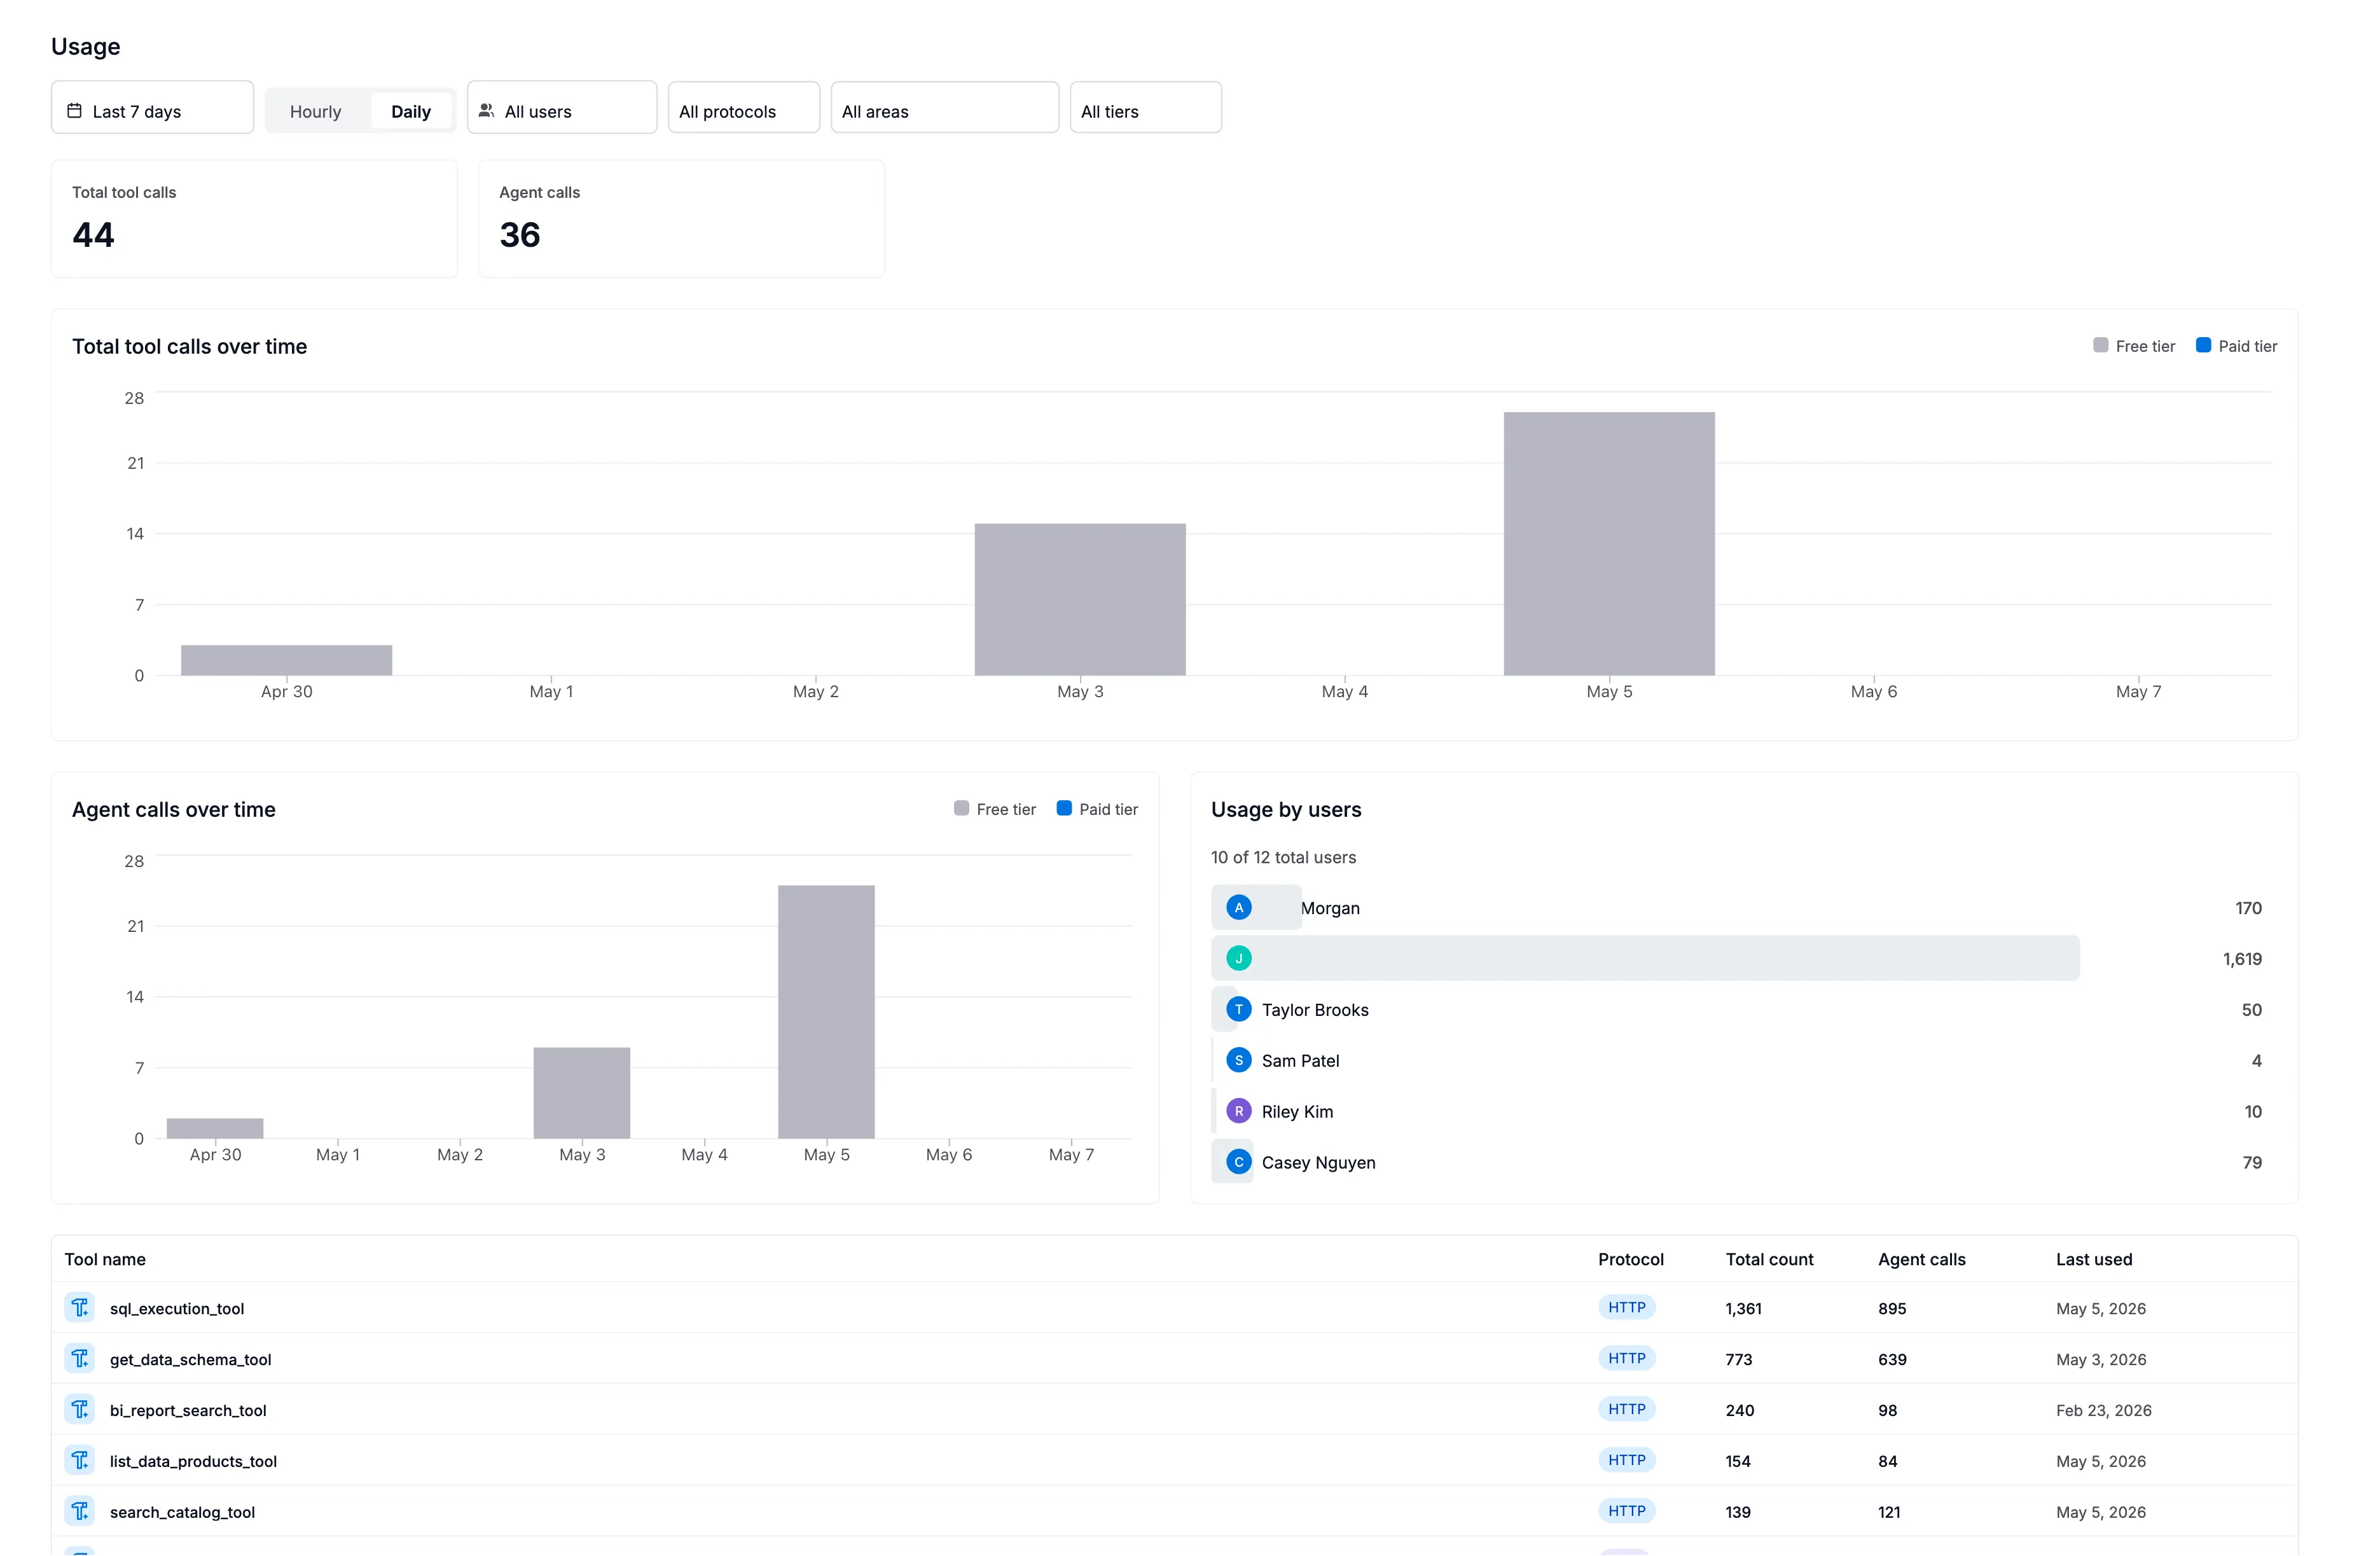
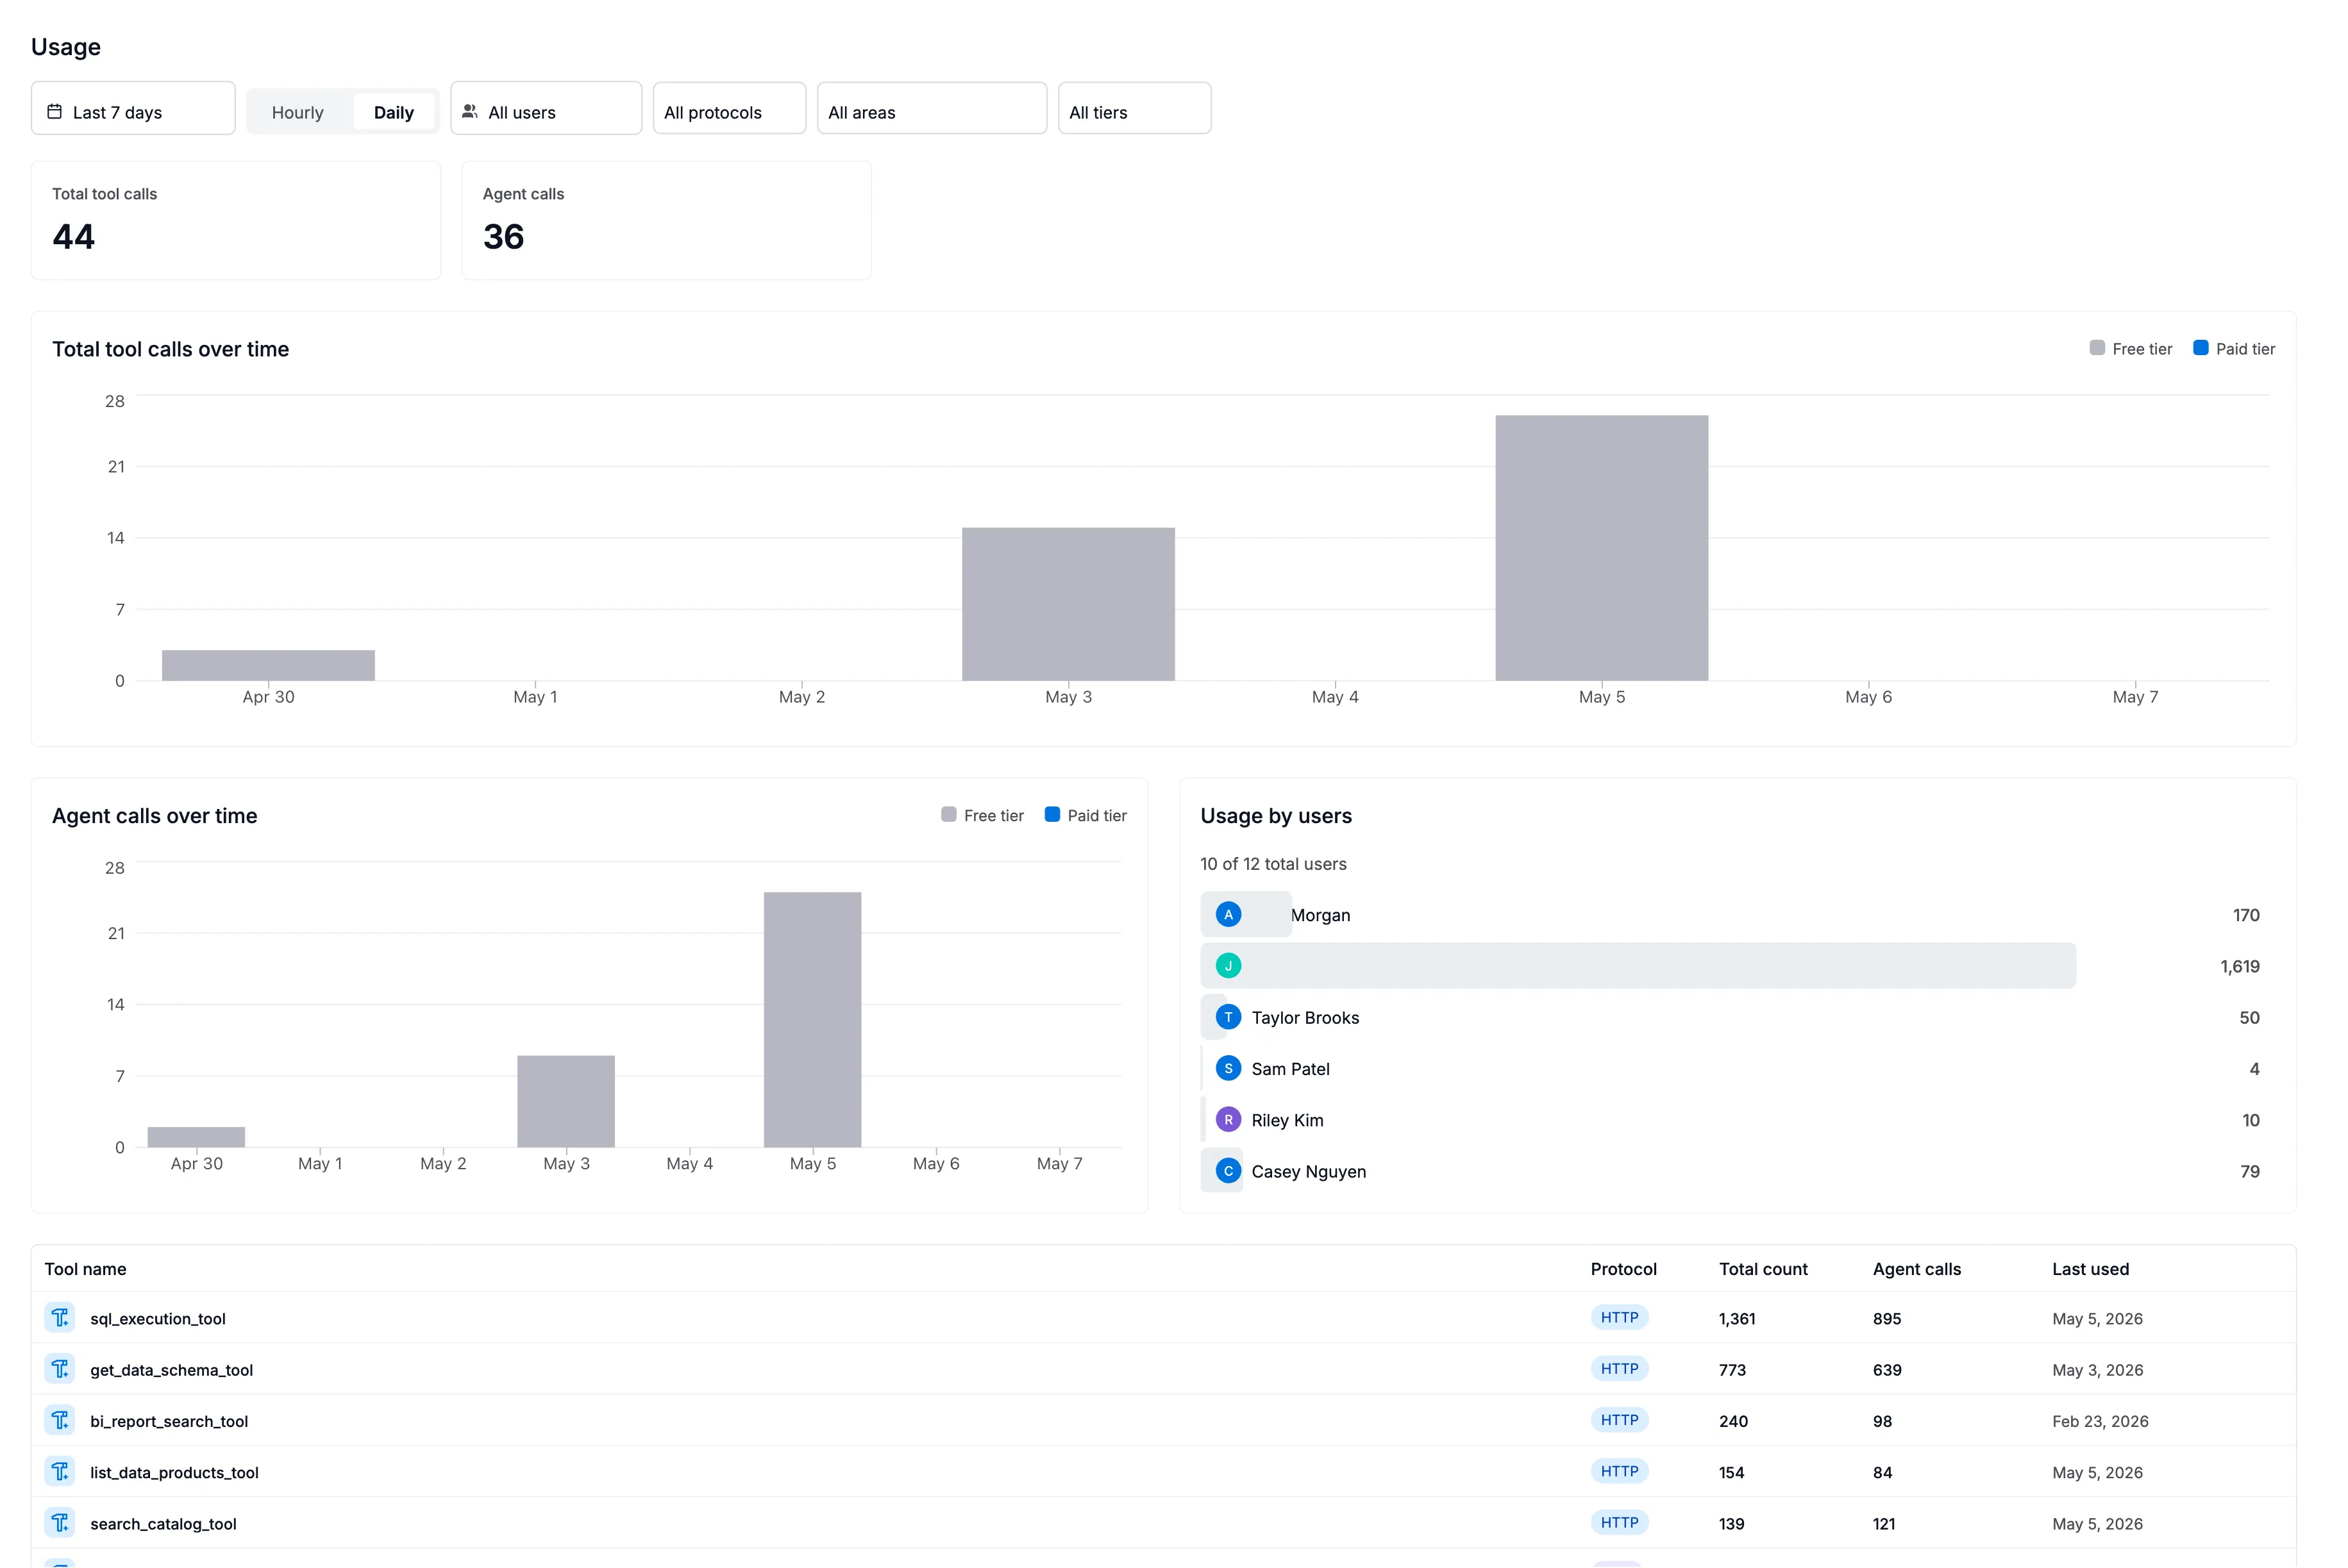
Usage
The Usage page gives you a clear picture of how your organization is using AI features in Agent Studio. It answers questions like: How many tool calls were made this month? Which agents are most popular? Are we approaching our quota?
Overview
Section titled “Overview”The Usage page shows aggregated counts of every AI interaction in your tenant — every agent run, every tool call, and every backend action (such as LLM calls or SQL queries). Data is broken down by time period so you can spot trends, identify spikes, and understand adoption patterns.
What each column means
Section titled “What each column means”Metric type
Section titled “Metric type”Every interaction is classified into one of three types:
| Type | What it represents |
|---|---|
| Agent | A complete agent run — the agent received a prompt, reasoned, called tools, and produced a response |
| Tool | A single tool call made by an agent (e.g., searching the catalog, executing a query, fetching a data source) |
| Action | A backend operation that supports the AI — LLM inference calls, Alation API lookups, SQL query execution |
A single agent run typically triggers multiple tool calls and actions. For example, asking an agent to “find revenue tables” might generate 1 agent run, 3 tool calls (search catalog, get data schema, get object fields), and 2 actions (LLM calls).
Metric name
Section titled “Metric name”The specific name of the agent, tool, or action. Examples:
- Agent names:
sql_query_agent,catalog_context_search,charting - Tool names:
search_catalog,execute_query,get_data_sources - Action names:
query,search,data_source
Protocol
Section titled “Protocol”How the interaction was triggered:
| Protocol | Meaning |
|---|---|
| HTTP | A call from the Agent Studio UI or a direct REST API integration |
| MCP | A call from an MCP client (Claude Desktop, Cursor, VS Code, etc.) |
This helps you understand where your usage is coming from — internal UI users vs. external MCP integrations.
Product area
Section titled “Product area”Which Alation product triggered the usage:
| Product area | Description | Counts against quota? |
|---|---|---|
| Agent Studio | Direct usage via Agent Studio UI or API | Yes |
| Unknown | Requests where no product area was specified | Yes |
| Catalog Search | AI-powered search in the Alation catalog | No |
| Data Product Marketplace | Data product generation and evaluation | No |
| Alamigo | The Alamigo virtual support assistant | No |
| Curation Hub | AI-assisted curation workflows | No |
| Critical Data Manager | Critical data management workflows | No |
The pricing tier that was active when usage occurred:
| Tier | Meaning |
|---|---|
| Free | Usage counting against your one-time free grant (never resets) |
| Paid | Usage on an active subscription (resets monthly) |
Time periods
Section titled “Time periods”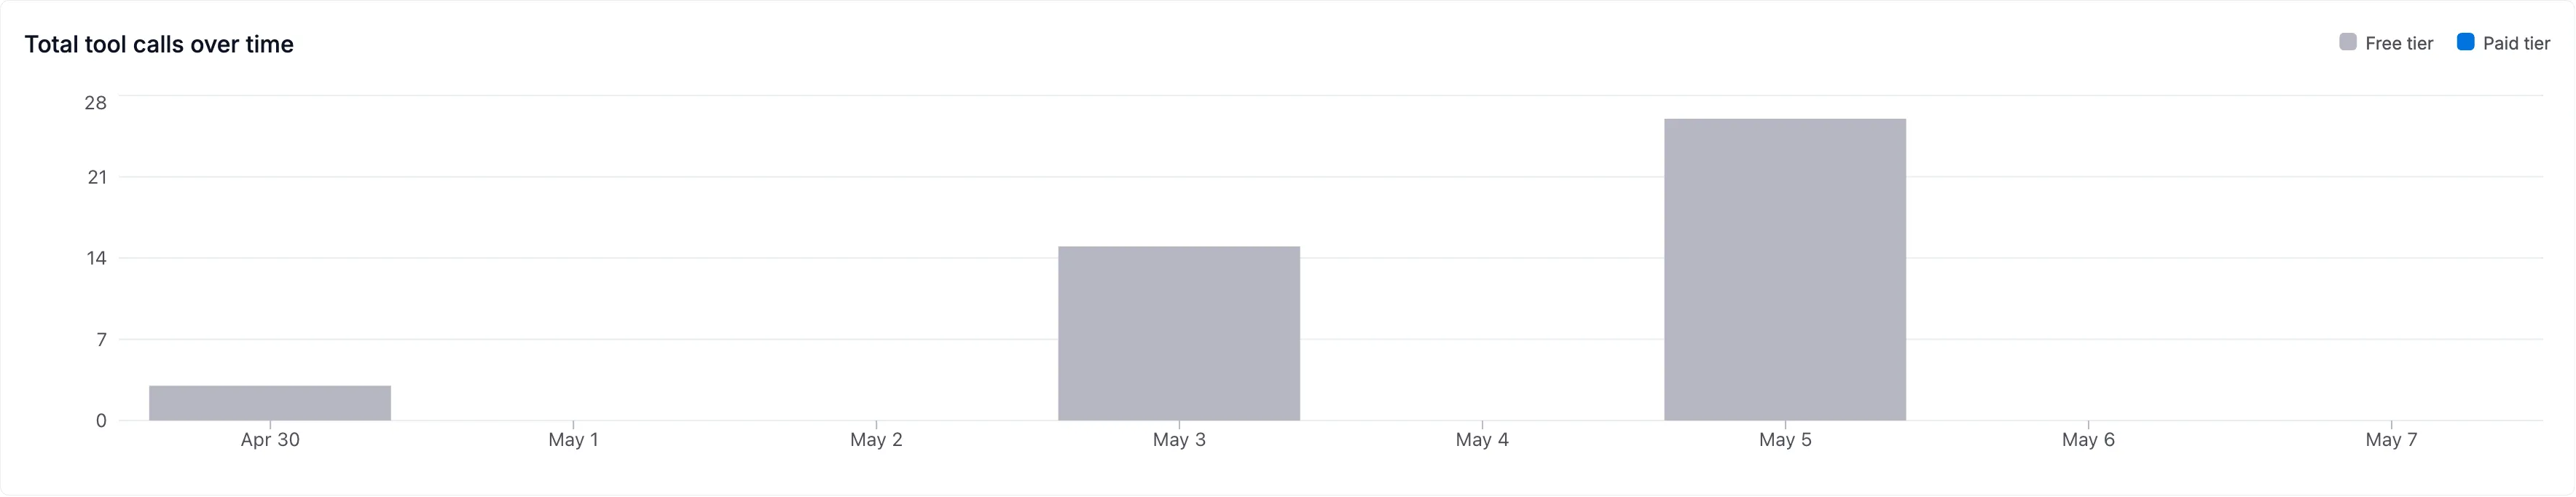
Usage is shown at three levels of detail:
| Granularity | What it shows | Best for |
|---|---|---|
| Hourly | Counts per hour | Investigating specific spikes |
| Daily | Counts per day | Week-over-week trends |
| Monthly | Counts per month | Billing and capacity planning |
Each time bucket shows two numbers:
- Count — total number of invocations
- Unique requests — how many distinct user requests generated those invocations
Understanding your quota
Section titled “Understanding your quota”Agent Studio enforces usage limits based on your plan:
- Free tier — a one-time cumulative grant of tool calls that never resets. Once exhausted, tool calls are blocked until you upgrade.
- Paid tier — a monthly allocation that resets at the start of each billing period.
Only tool calls from quota-applicable product areas (Agent Studio and Unknown) count against your limit. Agent runs and actions do not consume quota directly.
Filtering the view
Section titled “Filtering the view”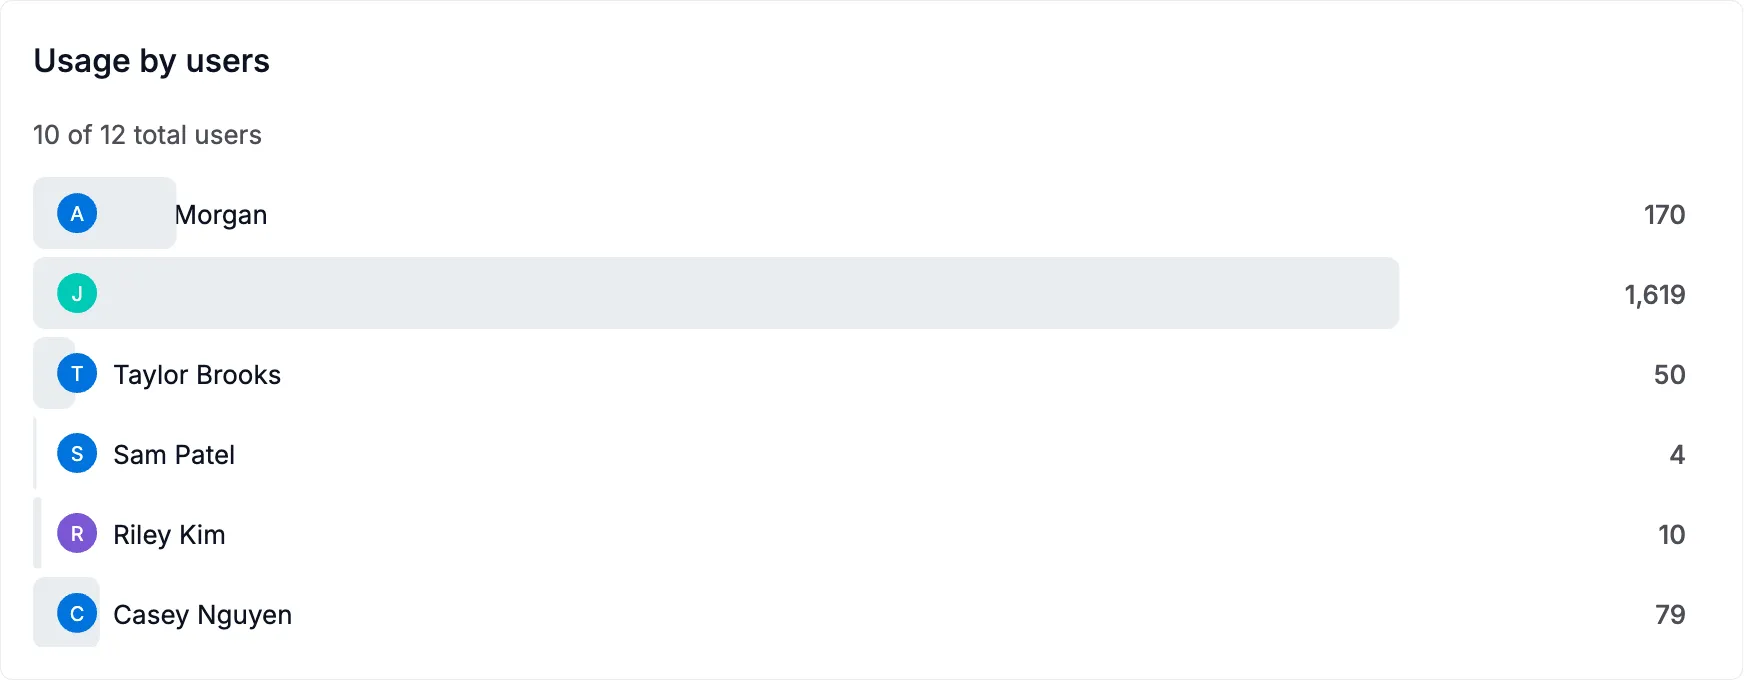
You can narrow what you see on the Usage page by:
- User — see a specific person’s usage (admins only)
- Metric type — focus on just agents, tools, or actions
- Protocol — compare MCP vs. HTTP usage
- Product area — isolate Agent Studio usage from internal features
- Tier — view only free or paid consumption
- Time granularity — switch between hourly, daily, or monthly views
Common questions
Section titled “Common questions”Why do I see usage I didn’t initiate? Some product areas (Catalog Search, Alamigo, Curation Hub) use AI features on your behalf as part of normal product operation. These show up in usage data but do not count against your quota.
Why is there a delay before my usage appears? Usage events are aggregated periodically (typically within a few minutes). Very recent activity may not appear immediately.
What’s the difference between “count” and “unique requests”? A single user request (like asking an agent a question) can trigger multiple tool calls internally. “Count” is the total number of tool calls, while “unique requests” is the number of original user requests that produced them.
Does Ask Alation (Alamigo) affect my tool usage quota?
No. Alamigo is classified under the alamigo product area, which is exempt from quota. Ask Alation usage appears in the Usage page for visibility, but does not consume your tool call allocation.
Permissions
Section titled “Permissions”| Role | What you can see |
|---|---|
| Server Admin | All users’ metrics across the entire tenant |
| All other roles | Only your own usage |